What is Data Science?
The field of “data science” integrates mathematical and statistical techniques, specialized programming, sophisticated analytics, artificial intelligence (AI), and machine learning with specialized subject matter expertise to reveal valuable insights concealed within an organization’s data. Making decisions and developing a strategy can be aided by these insights.
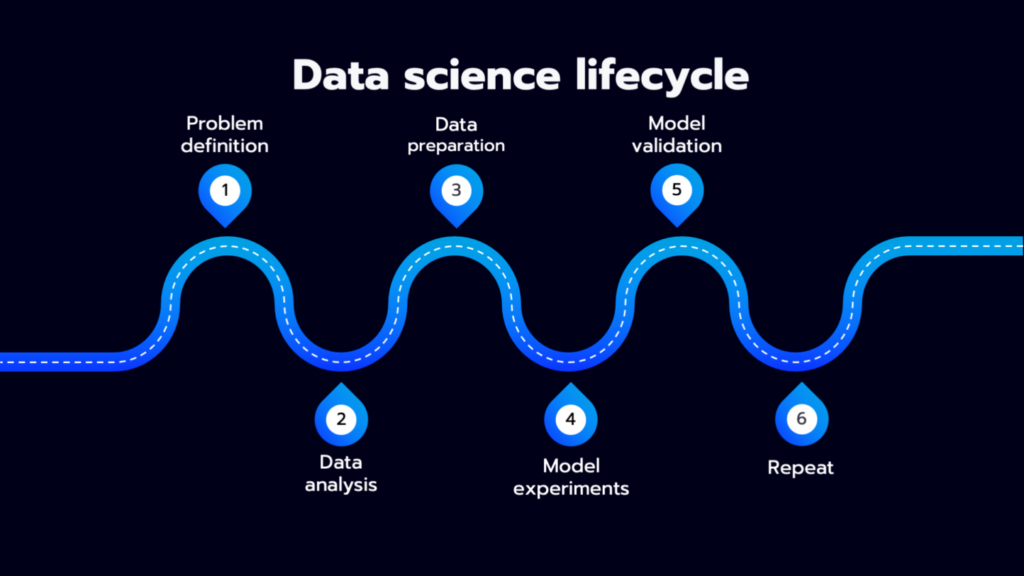
Many roles, tools, and processes that are a part of the data science lifecycle can be used by analysts to gain valuable insights. The following stages are typical for a data science project:
Data ingestion: The first phase of the lifecycle entails using a range of techniques to collect data, both structured and unstructured, from all pertinent sources. These methods include, among others, web scraping, manual entry, and real-time data streaming from devices and systems. Both structured and unstructured information, such as consumer data, can be found in data sources along with unstructured data from sources including social media, log files, video, audio, photos, and the Internet of Things (IoT).
Data storage and data processing: Businesses must take into account various storage systems depending on the type of data that has to be captured, as data can have a variety of formats and structures. Data Management teams help to set standards around data storage and structure, which facilitate workflows around analytics, machine learning, and deep learning models. This stage includes cleaning data, deduplicating, transforming, and combining the data using ETL (extract, transform, load) jobs or other data integration technologies. This data preparation is essential for promoting data quality before loading into a data warehouse, data lake, or other repository.
Data analysis: Data scientists do an exploratory data analysis to look at biases, trends, ranges, and distributions of values within the data. This data analytics exploration is what generates the hypothesis for a/b testing. It also allows analysts to evaluate whether the data is suitable for modeling in the context of deep learning, machine learning, and/or predictive analytics. Depending on the model’s accuracy, organizations may rely on these insights to make business decisions, which could result in increased scalability.
Communicate: Lastly, to help business analysts and other decision-makers better grasp the insights and their implications for the company, the insights are provided as reports and other data visualizations. The components for creating visuals are built into data science programming languages like R or Python; alternatively, data scientists can use specialized visualization tools.
What is data science used for?
Data science is used to study data in four main ways:
1. Descriptive analysis
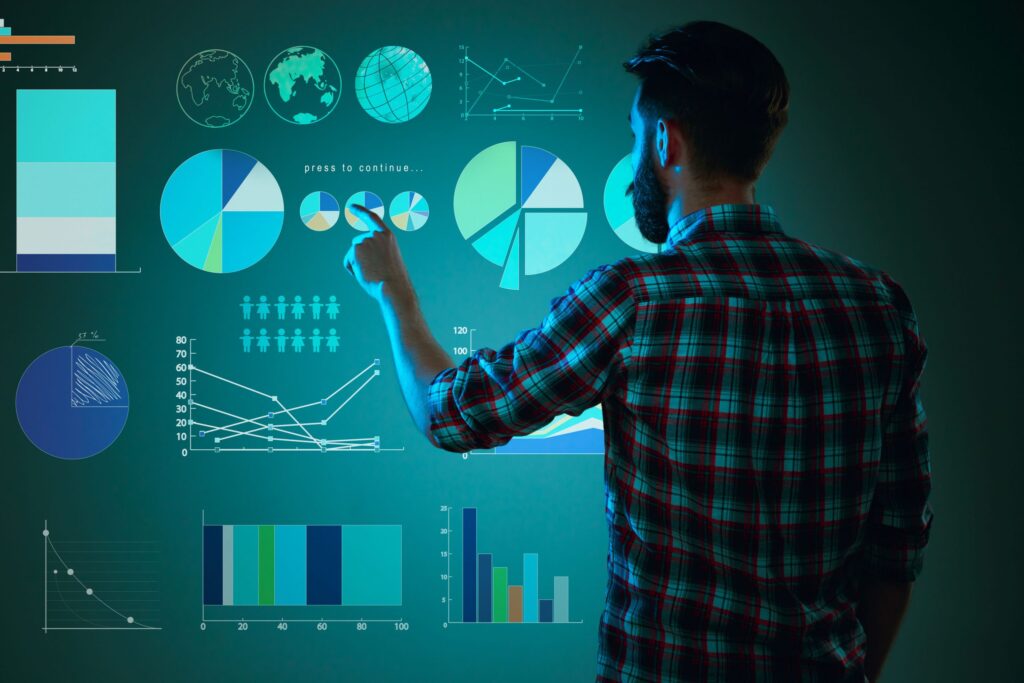
To understand what occurred or is occurring in the data environment, descriptive analysis looks at data. Data visualizations, such as tables, produced narratives, pie charts, bar charts, and line graphs, are what define it. For instance, a travel agency could keep track of information such as the quantity of tickets reserved daily. For this service, descriptive analysis will show booking peaks, booking troughs, and peak month performance.
2. Diagnostic analysis
To determine why something occurred, diagnostic analysis is a thorough data study. Drill-down, data mining, data discovery, and correlations are some of the strategies that define it. It is possible to find distinct patterns in each of these methods by applying various data operations and transformations to a given data collection. For instance, to better understand the booking spike, the flying service may examine a particularly successful month in detail. This might reveal, for example, that a monthly sporting event in a certain city draws a large number of visitors.
3. Predictive analysis
Techniques like machine learning, forecasting, pattern matching, and predictive modeling are what define it. Computers are taught to reverse engineer causality relationships in the data in each of these methods. For instance, at the beginning of the year, the airline service team might use data science to forecast flight booking trends for the upcoming year. Based on historical data, the algorithm or computer program can forecast May booking peaks for particular locations. Anticipating its customers’ future travel needs, the corporation may begin focusing on such cities with customized advertising in February.
4. Prescriptive analysis
It not only predicts what is likely to happen but also suggests an optimum response to that outcome. It can analyze the potential implications of different choices and recommend the best course of action. It uses graph analysis, simulation, complex event processing, neural networks, and recommendation engines from machine learning.
Back to the flight booking example, prescriptive analysis could look at historical marketing campaigns to maximize the advantage of the upcoming booking spike. A data scientist could project booking outcomes for different levels of marketing spend on various marketing channels. These data forecasts would give the flight booking company greater confidence in their marketing decisions.
Data Science and Analytics.
While the terms may be used interchangeably, data analytics is a subset of data science. Data science is an umbrella term for all aspects of data processing—from the collection to modeling to insights. On the other hand, data analytics is mainly concerned with statistics, mathematics, and statistical analysis.
Convey your ideas to us.
Your feedback is important to us.
